Tracking from minute one
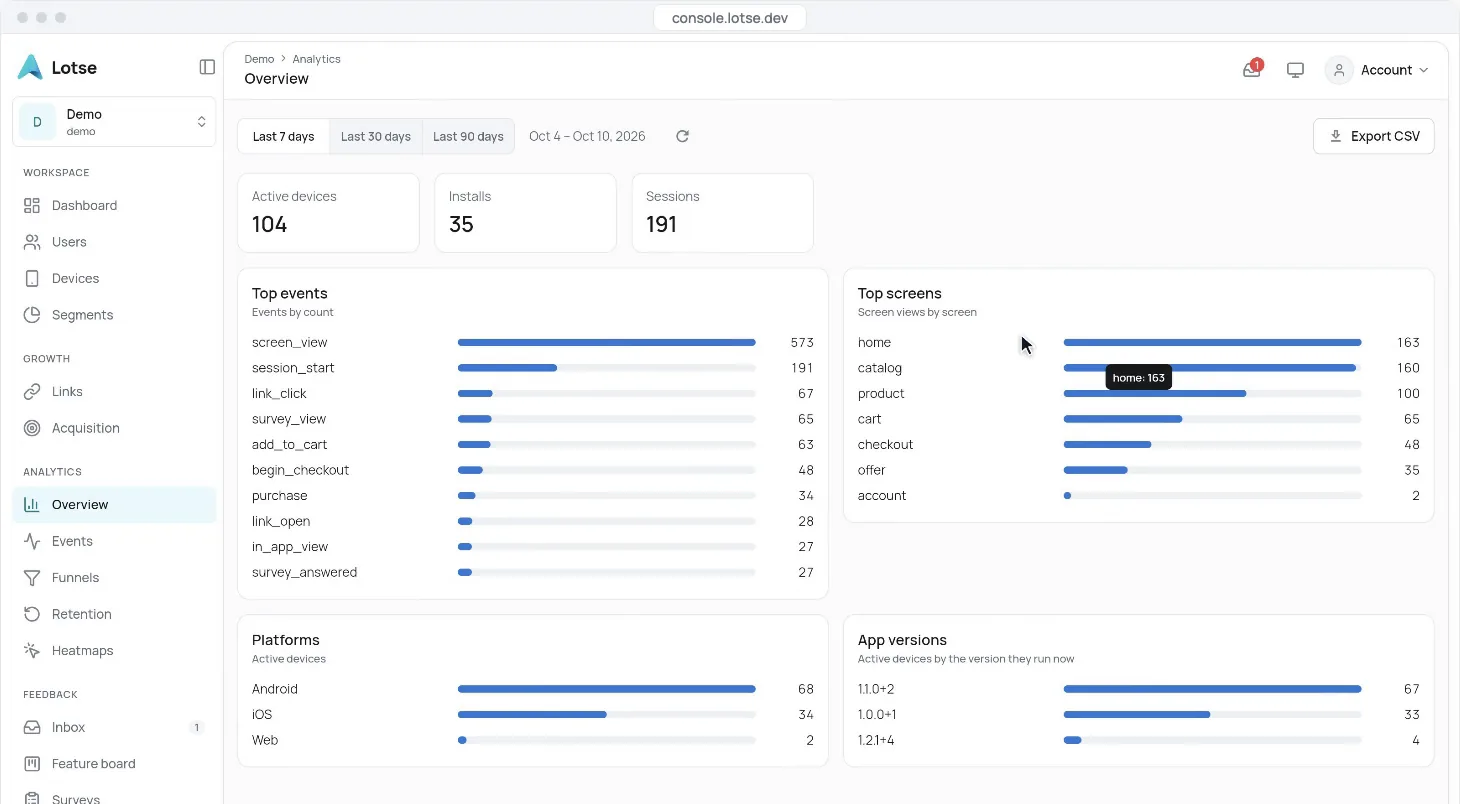
Screens, sessions and installs are counted automatically. Add your own events with one line.
Analytics
Events, funnels and retention — counted for real users and split by the campaign that brought them.
Why Lotse analytics
Not a wall of charts. Every screen surfaces what changed and what to do next.
Screens, sessions and installs are counted automatically. Add your own events with one line.
Funnels show the step where people drop off — and save them as a segment.
Retention cohorts by week, split by campaign or platform.
The aha moment
Split any funnel by origin campaign. In this example the newsletter brings buyers and the spring sale brings visitors.
spring-sale loses most users at checkout. Save them as a segment and send a push.
One user, one story
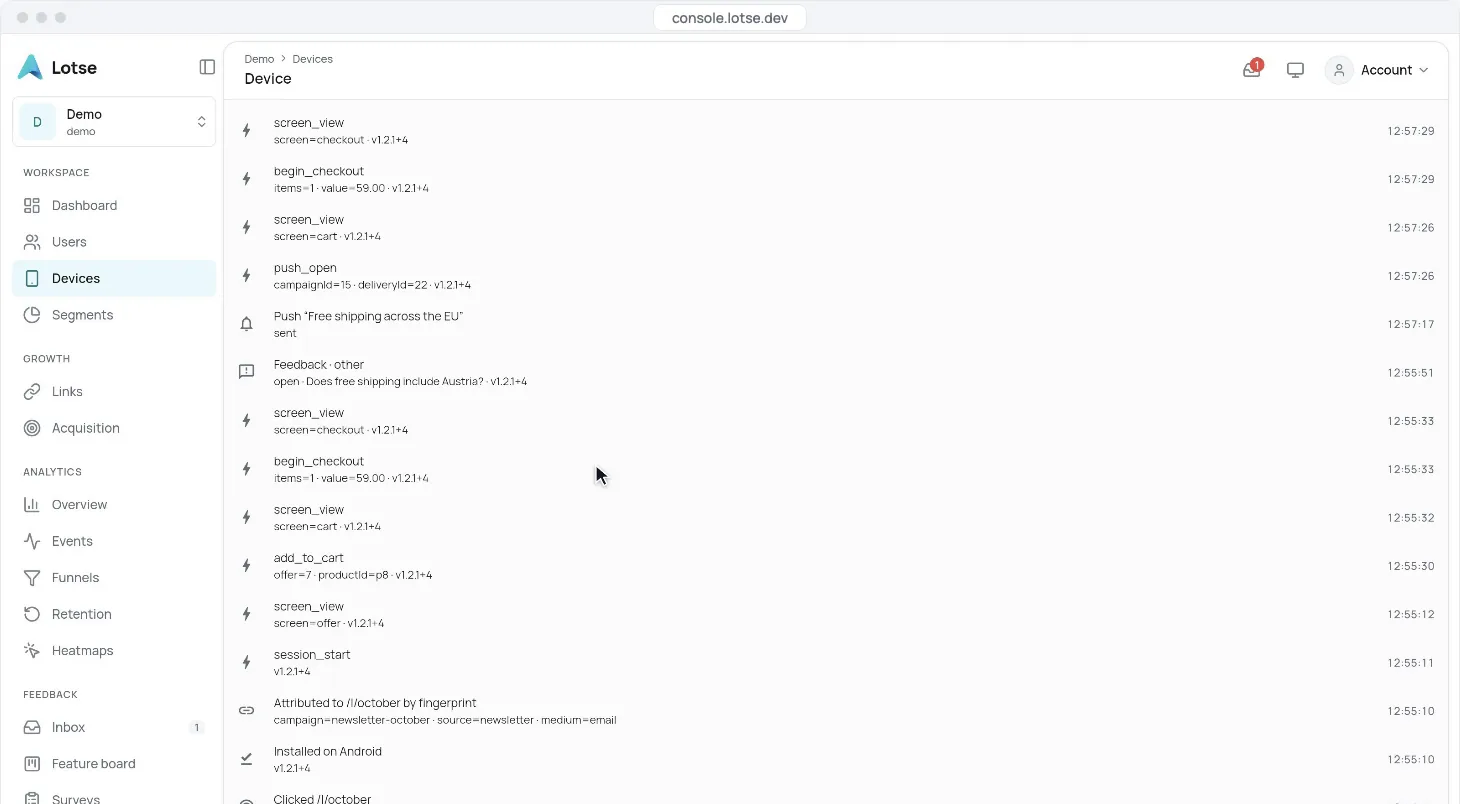
The timeline shows every event of a device in order: link, install, screens, feedback, push, purchase.
Compared
Specialists go deeper in analysis. Lotse links every number to acquisition, push and feedback.
| Lotse | Firebase | Mixpanel | |
|---|---|---|---|
| Funnels and retention | yes | yes | yes |
| Attribution | yes | limited | no |
| One segment across all of it | yes | no | no |
| EU data residency | yes | difficult | possible |
| Native to Serverpod | yes | no | no |
In each single discipline the specialist goes deeper. The value of Lotse is in the transitions.
For developers
// counted on their own: install, session_start, screen_view

Lotse.instance.track('add_to_cart', props: {
  'productId': 'p8',
  'value': '59.00',
});
No. Screens, sessions and installs are counted automatically; your own events show up as soon as they arrive.
Yes. Every table exports as CSV.
Yes. Every device carries the campaign of the link it came from, so funnels and retention split by it.
Analytics
Add the SDK and open the console — events arrive within seconds.